In my experience, currency markets (and most other securities) markets tend to be governed by trends. There are short-term trends, long-term trends, and medium-term trends. Granted, this is an oversimplification, but generally speaking, if you were to chart a given currency pair, you could characterize its fluctuations in accordance with this paradigm.
Short-term trends are typically the focus of technical analysts, who ignore the broader forces affecting a given currency pair and instead try to discern slight trading patterns. Long-term trends, on the other hand, are the purview of economists, and reflect interest rate and growth differentials. Medium-term trends, meanwhile, unfold over a period of months (sometimes shorter, sometimes longer) and require a combination of technical and fundamental analysis to discern and trade successfully. With this post, I want to focus on the current medium-term trend, which is that of declining risk aversion.
I would not use the expression “old” news to describe the stock market (and accompanying) rallies that have taken hold broadly since the beginning of March, since it’s still be unfolding. Given that hindsight is 20/20, it now appears that the (perceived) stabilization of the US financial sector provided the impetus for the rally. In the weeks that followed, investors pulled an about-face and piled back into risky sectors and trades. The US stock market rapidly reversed course and is now trading around the level following the Lehman Brothers collapse last October.
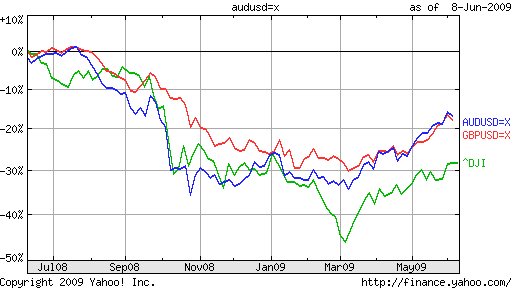
The rally in March marked the end of one medium-term trend and the beginning of a diametrically opposed, but conceptually similar medium term-trend. Sorry to make it sound complicated, since it’s actually quite simple; in an overnight switch, investors went from being bearish and risk-averse to bullish and risk-seeking. These mindsets (and the switch between) is also reflected in currency markets. You can see from the chart below how the Australian Dollar, British Pound, and Down Jones Industrial Average have tracked each other closely over the last year, and moved in lockstep since March 3.

I suppose you could say that the correlation between US stocks and currencies represents one continuous long-term trend, and based on this chart, you would be making an accurate assessment. However, it’s equally important to unveil the underlying mindset that is driving both stocks and currencies, and is causing them to move in tandem. This is a nuanced distinction, and an important one to understand. There is a difference between a change in sentiment that causes investors to simultaneously pour money into risky investments (stocks and currencies, etc.) and a change in sentiment that causes a stock market rally and consequently, a currency rally. In the first scenario, both currency traders and stock market investors are in tacit agreement over risk-seeking, while in the second scenario, currency traders are uncertain, and hence taking their cues from the stock market.
Part of what makes a good currency trader is discerning which of these scenarios accurately describes the current reality in forex markets, so that a viable forecast and trading strategy can be implemented. Scenario 1 suggests that if the stock market rally falters, risky currencies will also decline. Scenario 2, meanwhile, suggests that currency traders would maintain their positions even in the event of stock weakness, which would cause the correlation between forex and the S&P to break down.
Source:www.forexblog.org


